7.1. Tracing
In one glance
- You will: Keep ADK traces off by default, accept their content risk for one synthetic turn, read that turn span by span in Tempo, and open the two-run evaluation dashboard.
- You need: Docker running,
mise run observability:upserving Tempo onhttp://localhost:3200and Grafana onhttp://localhost:3002, and Ollama servingqwen3:4b-instruct. - Time: about 40 minutes, hands-on, plus model time — the drill asks for four turns, and the ones captured on this page took between thirty seconds and five minutes each.
Why one turn needs a trace, not a log line
A trace records how one request’s work was structured in time. Every unit of work becomes a span with a start time, an end time, a status, and a parent, and every span in one request shares one trace id. The result is a tree you read top-down — the turn, the model calls under it, the tool calls under those, the MCP round trip under a tool.
A log line records only that something happened. When a turn takes far longer than it should, the log line of the final answer cannot say whether the model, a tool, or the gateway spent the time, so the latency argument stays unresolvable. This page reads one real turn span by span, names the hop that spent the time, and explains why ADK’s spans ship switched off until you accept a content risk explicitly.
Here is one real turn on a CPU-only laptop, pulled out of Tempo by trace id and flattened into start offset, duration, status, and span name, with both times in milliseconds. The pipeline sorts by start offset rather than by duration, because a child that starts late tells you what it waited for:
curl -s "http://localhost:3200/api/traces/<trace id>" | jq -r '
  [.batches[].scopeSpans[].spans[]]
  | (map(.startTimeUnixNano | tonumber) | min) as $t0
  | sort_by(.startTimeUnixNano | tonumber)[]
  | [ (((.startTimeUnixNano | tonumber) - $t0) / 1000000 | floor),
      (((.endTimeUnixNano | tonumber) - (.startTimeUnixNano | tonumber)) / 1000000 | floor),
      (.status.code // "UNSET"),
      .name ]
  | @tsv'
0 333925 UNSET invoke_agent agentops_agent
0 152539 UNSET generate_content qwen3:4b-instruct
152568 5 UNSET execute_tool get_service_status
152598 181288 STATUS_CODE_ERROR generate_content qwen3:4b-instructThe question was “what is the status of the checkout service?”, and yours will be far faster. Read the shape rather than the numbers, starting with the statuses: UNSET means success, because ADK sets ERROR only where it records one, so a quiet span is healthy rather than silent. The tool call, the part everyone blames first, took five milliseconds out of five and a half minutes. Two model calls took everything else, and the second never returned, so its span carries STATUS_CODE_ERROR.
Shape changes with the entrypoint, too: mise run workflow shows plan, investigate, evidence_review, and recommend as four separate bars instead of one opaque stage.
Read the turn span by span
Grafana draws that flat list as a waterfall. Open http://localhost:3002, go to Explore, select the Tempo datasource, and either search by service name agentops-agent or paste a trace id into the TraceQL box. Tempo ships no UI of its own — it stores spans and answers queries on :3200, and Grafana renders them, which is why traces sit beside metrics and logs.
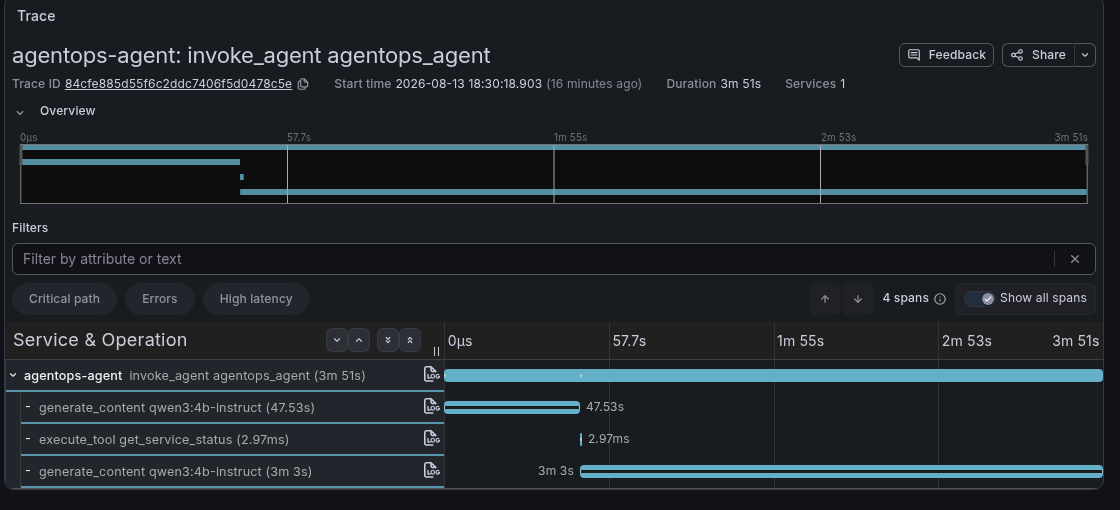
That is a different turn from the flat listing above — a shorter question on the same laptop — and it makes the same point in one picture. Four spans, one of which is the tool everybody blames: execute_tool get_service_status is 2.97 milliseconds, drawn as a sliver you have to look for. The two generate_content bars are the turn. Read the second one’s start offset rather than its length to see why: it could not begin until the tool it was waiting for had returned.
Predict first: which of those four rows carries the token counts for the whole turn?
Row 1, invoke_agent agentops_agent, 333,925 ms. This is the turn itself: ADK opens it once per invocation under its gcp.vertex.agent scope, and every other span hangs off it. Its attributes answer “which agent, which conversation, at what cost”:
curl -s "http://localhost:3200/api/traces/<trace id>" | jq -r '
  .batches[].scopeSpans[].spans[]
  | select(.name | startswith("invoke_agent"))
  | .attributes[] | .key + " = " + ((.value.stringValue // .value.intValue) | tostring)'
gcp.vertex.agent.invocation_id = e-62104bd3-2892-4b55-8176-0e9d920163ec
gen_ai.operation.name = invoke_agent
gen_ai.agent.name = agentops_agent
gen_ai.conversation.id = eea19e8c-fdcf-4039-99fc-eed1f17d2c42
agentops.tokens.session.input = 2687
agentops.tokens.session.output = 21
agentops.tokens.session.total = 2708
agentops.cost.session.estimate = 0The gen_ai.* and gcp.vertex.agent.* keys are ADK’s, following the OpenTelemetry GenAI conventions. Adopt them, pin the schema you validated against, and expect churn: they moved to their own semantic-conventions-genai repository on 5 May 2026 and every document there is still marked Development. The Go side churns too: go.opentelemetry.io/otel/log v0.21.0, on 3 August 2026, deleted the Value and KeyValue types ADK Go v2.2.0 calls, which is why agents/go/go.mod holds OTel at stable 1.44 with log 0.20. The four agentops.* keys are this repository’s own: RecordTokenUsage stamps the session’s running totals onto whichever span is active, because a Prometheus counter could only answer “what did this conversation cost” by making the session id a label — and a session id as a label is an unbounded series. The root span is where the totals live, and 7.3. Costs gives them a budget.
Row 2, the first generate_content, 0 → 152,539 ms. It starts at the same instant as its parent, so nothing happened before the model was asked. It carries gen_ai.usage.input_tokens = 2687 and gen_ai.usage.output_tokens = 21: the model read the whole instruction plus the session history and replied with a single tool call.
Row 3, execute_tool get_service_status, starting at 152,568 ms and lasting 5 ms. The interesting number is the start offset, not the duration: the tool was neither slow nor blocked, it simply could not run until the model decided to call it. Two attributes carry its payload:
gcp.vertex.agent.tool_call_args = {"name":"checkout"}
gcp.vertex.agent.tool_response = {"open_incidents":[{"id":"INC-009",...,"title":"<<<TOOL_DATA data-
Look inside that response: the tool result reaches the trace already wrapped in the TOOL_DATA fence from 4.5. Guardrails, so you can watch the untrusted-content boundary do its job. It also reaches the trace whole: whatever the tool returned is serialized onto that span, which is why the next section is about keeping these spans off by default.
Row 4, the second generate_content, 152,598 → 333,886 ms, STATUS_CODE_ERROR. A failing span records an exception event, and the event body is where the reason lives:
curl -s "http://localhost:3200/api/traces/<trace id>" | jq -r '
  .batches[].scopeSpans[].spans[].events[]?
  | .name + ": " + (.attributes[] | select(.key == "exception.message") | .value.stringValue)'
exception: openai: call failed: Post "http://127.0.0.1:11434/v1/responses": context deadline exceeded (Client.Timeout exceeded while awaiting headers)Four rows, one verdict: the agent’s code and its tool spent five milliseconds, the model provider spent the rest and then timed out.
Why ADK spans stay off until you accept the risk
You will not find that tree in Tempo yet, by design. Every agent entrypoint applies a privacy rule before dispatch, and runtime assembly reapplies it before either provider-ownership path constructs an ADK provider. Those are the last moments before a span could be recorded; a check any later would leave a window in which content-bearing spans already exist:
// SetContentCaptureDefaults pins both content-capture switches to "false"
// unless the operator has already chosen a valid value, and disables the
// pinned ADK's unsafe spans unless the operator explicitly accepts their
// content-bearing behavior.
//
// ADK Go v2.2.0 always serializes tool arguments and results onto execute_tool
// spans and records raw error text in exception events. Neither capture switch
// controls those fields, and the ADK provider offers no stable field-filtering
// seam. Therefore false, unset, or malformed
// ADK_CAPTURE_MESSAGE_CONTENT_IN_SPANS forces OTEL_TRACES_SAMPLER=always_off,
// overriding any sampler the environment supplied. Malformed values also
// return an error after the boundary is closed. Only the exact literal "true"
// accepts that risk and preserves the operator's sampler choice.
//
// The GenAI switch remains an ordinary default because it controls log-event
// bodies, which the repository sanitizes on both durable log paths. Call this
// before the launcher builds telemetry providers. It is safe and intentional
// to call it again at the provider boundary so direct runtime assembly cannot
// bypass the fail-closed rule.
func SetContentCaptureDefaults() error {
	var problems []error
	pin := func(name, value string) {
		if err := os.Setenv(name, value); err != nil {
			problems = append(problems, fmt.Errorf("pinning %s to %q: %w", name, value, err))
		}
	}

	adkCapture, chosen := os.LookupEnv(EnvADKCaptureMessageContent)
	riskAccepted := chosen && adkCapture == ContentCaptureEnabled
	malformed := chosen && adkCapture != ContentCaptureEnabled && adkCapture != ContentCaptureDisabled
	if !riskAccepted {
		// Normalize malformed values as well as the unset case. A typo in a risk
		// acceptance switch must close the boundary, not silently open it.
		pin(EnvADKCaptureMessageContent, ContentCaptureDisabled)
		pin(EnvTracesSampler, TraceSamplerDisabled)
	}
	if malformed {
		problems = append(problems, fmt.Errorf(
			"%s must be the literal %q or %q",
			EnvADKCaptureMessageContent, ContentCaptureEnabled, ContentCaptureDisabled,
		))
	}

	if _, genAIChosen := os.LookupEnv(EnvGenAICaptureMessageContent); !genAIChosen {
		pin(EnvGenAICaptureMessageContent, ContentCaptureDisabled)
	}
	return errors.Join(problems...)
}
That function rewrites the environment before anything else reads it. Anything other than the exact literal true in ADK_CAPTURE_MESSAGE_CONTENT_IN_SPANS — unset, false, or a typo — pins the switch to false and pins OTEL_TRACES_SAMPLER to always_off, overriding whatever sampler the operator exported. A typo also returns an error, after the boundary has already closed, so a misspelled risk acceptance stops startup instead of silently opening it. The same rule covers adk web’s built-in trace view: a missing trace before you opt in is the intended privacy state, not an exporter fault.
ADK traces are content-bearing in this pinned release
ADK Go v2.2.0 serializes tool arguments and results on every execute_tool span and can record raw error text in exception events — you read both in the previous section. Neither capture switch filters those fields, and the SDK exposes no stable mutable end-of-span filter. Use explicit true only with this repository’s fictional seed data; never with real incidents, people, credentials, or provider bodies.
Logs and spans are not defended the same way. Structured logs are actively defended: before a record reaches the console or OTLP, independent handlers redact personal-data and credential patterns, cap every string at 2048 characters, and keep only sanitized error evidence. Spans get no such filter. Their defense is that they are non-recording by default. Turning them on is a risk decision, not a verbosity setting.
Prompts, responses, and eval verdicts still need a home, and this course deliberately does not ship one. Langfuse and Arize Phoenix are the open-source category that owns exactly it: prompt, response, and evaluation storage with its own retention window and access model, rather than a general-purpose trace store the whole team can already read. The OTel collector is the seam such a backend attaches to; adding one is a decision about who may read a prompt, not a configuration change.
Three variables sit near that decision and their names do not match their jobs. The pinned Go ADK never reads the first one at all: this repository owns it as the risk gate, the value that decides whether the sampler may record anything.
| Variable | Repository meaning | Durable destination |
|---|---|---|
ADK_CAPTURE_MESSAGE_CONTENT_IN_SPANS | Exact true accepts known content-bearing ADK spans; anything else shuts them off | the trace store (Tempo :3200) |
OTEL_TRACES_SAMPLER | Forced to always_off until that risk is accepted | controls whether ADK spans are recorded |
OTEL_INSTRUMENTATION_GENAI_CAPTURE_MESSAGE_CONTENT | Enables GenAI model-message log events | the log store (Loki, via the collector) |
The PII callbacks in 4.5. Guardrails do not make those spans safe: raw session ingestion and framework error capture happen outside that boundary.
How one collector serves runtime traces and evaluation runs
Accept the risk for one synthetic request and point the agent at the collector. This is a live-model, content-bearing lab step, valid only because every incident, service, and runbook in this repository is fictional:
export ADK_CAPTURE_MESSAGE_CONTENT_IN_SPANS=true
export OTEL_TRACES_SAMPLER=always_on
export OTEL_EXPORTER_OTLP_ENDPOINT=http://localhost:4318
export OTEL_EXPORTER_OTLP_PROTOCOL=http/protobuf
export OTEL_SERVICE_NAME=agentops-agent
Two emitters reach one collector on different ports, and each port accepts one protocol only: the host agent speaks http/protobuf on 4318, agentgateway speaks gRPC on 4317. Mix them up and you get silence rather than an error. When both record they land in one trace, joined by trace context propagation — the gateway injects the trace_id and current span_id into the outbound request, and the agent’s SDK parents its spans under the gateway’s. The host gateway ships no tracing: block, so this opt-in produces agent spans only.
Inside, the traces pipeline is three steps and a fan-out:
traces:
  receivers: [otlp]
  processors: [memory_limiter, batch]
  exporters: [otlp_http/tempo, span_metrics]
Read those three keys as three roles: a receiver takes telemetry in, a processor shapes it in flight, an exporter sends it on. Every span then goes two places at once. otlp_http/tempo forwards it to http://tempo:4318, and the _http suffix is load-bearing: Tempo’s receiver speaks OTLP over HTTP only, so the plain otlp exporter would speak gRPC at it and silently fail every export. The span_metrics connector never leaves the collector — it turns spans into request-count and duration metrics sliced by gen_ai.operation.name and gen_ai.request.model, then re-injects them into the metrics pipeline. Your spans become RED metrics — Rate, Errors, Duration — with no instrumentation in the application, and 7.2. Monitoring takes it from there.
    flowchart TD
  A["risk-accepted turn<br/>invoke_agent span"] --> B["model spans"]
  A --> C["tool / MCP spans"]
  G["agentgateway spans"] -. same trace_id .-> A
  B --> H["OTLP HTTP 4318"]
  C --> H
  G --> I["OTLP gRPC 4317"]
  E["mise run eval<br/>agentops.eval.* signals"] --> H
  H --> K["OpenTelemetry Collector"]
  I --> K
  K --> L["traces pipeline<br/>memory_limiter, batch"]
  L --> M["otlp_http/tempo"]
  L --> N["span_metrics connector"]
  M --> Q["Tempo :3200<br/>read through Grafana"]
  N --> O["metrics pipeline"]
  O --> P["Prometheus scrape :8889"]
Diagram in words: One invoke_agent span contains model and tool spans, a gateway span can share its trace id, and an evaluation run pushes its own signals to the same endpoint. The collector batches spans, writes them to Tempo, and feeds bounded span metrics to Prometheus.
Tempo has no notion of an experiment or a project: a trace is addressed by its trace_id and nothing else, so there is no name to keep in sync and no header that can silently reroute your spans.
mise run eval writes results.json, and that file is the gate. Export EVAL_OTEL_EXPORTER_OTLP_ENDPOINT=http://localhost:4318 first, though, and the same run pushes an agentops.eval.run span tree and five gauges through the same collector. Grafana already has the dashboard that reads them:
curl -s "http://localhost:3002/api/search?query=AgentOps&type=dash-db" | jq -r '.[] | "\(.uid)\t\(.title)"'agentops-evaluation-comparison AgentOps evaluation comparison
agentops-overview AgentOps overviewThat is evals/grafana-dashboard.json, mounted into Grafana by the observability Compose file. Its two controls, Reviewed baseline run and Candidate run, are populated from the eval_run_id label, and both stay empty until your first exported run — so name your runs or you will be choosing between two uuids: mise run eval -- --run-id baseline-tone, then --run-id candidate-tone after you change the instruction.
The dashboard’s panels do not query the names the harness emits. The harness declares agentops.eval.score as a gauge with unit 1, and the collector’s Prometheus exporter renames every instrument on the way out: dots become underscores, a gauge whose unit is 1 gains a _ratio suffix, and a unit in braces such as {token} is dropped as an annotation. Guess wrong and Grafana says “No data” while every component is healthy, so the table below quotes the exporter’s names.
| Panel | The question it answers | What it computes |
|---|---|---|
| Score comparison | Which scorer moved, and in which direction? | avg of agentops_eval_score_ratio per run and scorer |
| Case pass rate | Did the whole run improve, or only one scorer? | avg of the 0-or-1 agentops_eval_case_passed_ratio |
| Cost evidence | What did the improvement cost? | sum of agentops_eval_tokens and agentops_eval_model_calls |
Read them in that order. A score that rose while the pass rate stayed flat means one scorer moved, not the agent; a pass rate that rose while tokens doubled means you bought it with retries. What these numbers can and cannot prove belongs to 4.4. Evaluations.
Optional exercise: settle the renaming in twenty seconds, before you spend twenty minutes on a run. Predict first — under what name does agentops.probe.score, a gauge with unit 1, reach Prometheus?
Mode:
inspect— two throwaway data points, posted and read back.Goal: see the renaming rule instead of trusting a paragraph about it.
Files to touch: none.
Preflight:
curl -fsS http://localhost:9090/-/healthyanswers.Steps: post one unit-
1gauge and one{token}gauge, then list what Prometheus learned.NOW="$(date +%s)000000000" curl -s -X POST http://localhost:4318/v1/metrics -H 'content-type: application/json' -d ' {"resourceMetrics":[{"resource":{"attributes":[{"key":"service.name","value":{"stringValue":"suffix-probe"}}]}, "scopeMetrics":[{"metrics":[ {"name":"agentops.probe.score","unit":"1","gauge":{"dataPoints":[{"asDouble":0.5,"timeUnixNano":"'"$NOW"'"}]}}, {"name":"agentops.probe.tokens","unit":"{token}","gauge":{"dataPoints":[{"asInt":"42","timeUnixNano":"'"$NOW"'"}]}} ]}]}]}' curl -s http://localhost:9090/api/v1/label/__name__/values | jq -r '.data[] | select(startswith("agentops_probe"))'Gate that proves completion: within two scrape intervals the second command prints
agentops_probe_score_ratioandagentops_probe_tokens— the suffix lands on the unit-1gauge only.Final state: nothing to undo; both probe series age out with Prometheus’s seven-day retention and neither name collides with a shipped panel.
Your turn: accept the risk for exactly one request
Predict before you run this: you have already exported OTEL_TRACES_SAMPLER=always_on. Start the agent with the shipped default in place — does that sampler win?
- Mode:
inspect— the drill changes only environment variables in one shell, and ends by putting them back. - Goal: watch the shipped default beat the sampler, then produce one synthetic trace tree and find the field that makes this a lab-only setting.
- Files to touch: none. No tracked file and no
.enventry changes; every variable lives in your shell. - Preflight:
curl -fsS http://localhost:3200/readyanswers. Then take back only the risk acceptance, leaving the sampler and exporter variables as you set them:unset ADK_CAPTURE_MESSAGE_CONTENT_IN_SPANS, and confirmenv | grep ADK_CAPTURE_MESSAGE_CONTENT_IN_SPANSprints nothing whileecho $OTEL_TRACES_SAMPLERstill printsalways_on. - Steps: start the agent in that shell and send one read-only question; look for its trace in Grafana. Then
export ADK_CAPTURE_MESSAGE_CONTENT_IN_SPANS=true, restart the agent, ask the same question, and open the new trace. - Gate that proves completion: the first run leaves Tempo with no ADK span even though
always_onis exported in that very shell; the second produces one tree you can walk with the commands above — root, model, tool, exception — and read a serialized argument off itsexecute_toolspan. - Final state: run
unset ADK_CAPTURE_MESSAGE_CONTENT_IN_SPANS OTEL_TRACES_SAMPLER, restart the agent, ask one more question, and confirm no new ADK trace appears.
While that risk is accepted, take one more step and make the gateway hop visible, because the diagram above claims something no shipped profile can show you. No profile in this repository configures gateway tracing: the host config has no tracing: block, and the k3d and GKE profiles pin the agent to always_off. So “a gateway span can share its trace id” has been a design claim rather than an observation. One opt-in flag on the wrapper turns it into evidence:
mise run gateway:host:stop
AGENTOPS_GATEWAY_TRACING_LAB=on infra/scripts/gateway-host.sh start
That renders a single config.tracing.otlpEndpoint pointing at the collector through the same bridge alias every other upstream uses; with the flag off, infra/scripts/gateway-host.sh render is byte-identical to the shipped config, which is the property that lets this exist at all. Point the agent’s OPENAI_BASE_URL at :4000 as 5.4. Model Gateway did, ask one question, and search Tempo for the trace: one trace_id should now carry two service.name values — the gateway’s and the agent’s — with the gateway’s span as the parent of the model call. That is the whole distributed-tracing lesson in one query, and it is the reason context propagation is a header contract rather than a logging convention. Stop the gateway and start it again without the flag when you are done; the shipped profile stays untraced on purpose, because a proxy that exports spans by default exports them to somebody’s collector by default.
That last step is not housekeeping. The field you read off the execute_tool span was a fictional incident; on a real system it would be whatever a tool returned about a real person, written to a store with its own retention rules. The default is off because that is the only setting that is safe without a conversation first. Why the course separates a setting like this from the checks that prove behavior is spelled out once in 0.2. Evidence.
Deeper: the second place spans get dropped
The collector is the other place traces get shed: a memory_limiter (400 MiB soft cap, 100 MiB spike) sits ahead of the batch processor and refuses batches under memory pressure rather than letting the collector OOM. That is a deliberate trade — dropped telemetry over a dead collector — and it is why ObservabilityCollectorDown pages in 7.2b. Alerting.
Nothing in the application knows about any of this. The agent imports only OpenTelemetry and the sole mention of Tempo is the collector exporter above, which is what makes swapping the backend an operational decision rather than a code change.
What you can do now
- You can walk a turn span by span and name the hop that spent the time, from the root’s token totals down to an exception message.
- You can explain why startup forces
OTEL_TRACES_SAMPLER=always_offwhatever the operator exported, and name the fields that make an ADK span lab-only. - You can open
AgentOps evaluation comparison, pick two named runs, and say which scorer moved and what it cost. - The switch is false again, and a restarted agent records no new ADK spans.
Continue to 7.2. Monitoring, where those same spans become the metrics that tell you whether the last thousand turns were healthy.