7.2b. Alerting
In one glance
- You will: Watch a shipped alert move from pending to firing to resolved, learn why only two of the nine ever page anyone, and add your own rule with a test that watches it fire.
- You need: 7.2. Monitoring finished with the host Compose stack still running, plus
mise run install:platform—promtoolships in the platform tool tier, not in the coremise run install. - Time: about 40 minutes, hands-on.
Alerting decides which numbers may wake a person
An alert is a rule that decides, with nobody watching, that a condition has held long enough to be worth a person’s attention. Its severity routes that verdict: immediately, as a page that rings a phone, or into a queue as a ticket read during working hours. The dashboards from the previous page decide neither, because a dashboard only reports while somebody reads it.
Getting severity wrong costs you both ways. Page on everything and the third page of a night is ignored on principle. Page on nothing and you find out from a customer.
The worked example is a stopped telemetry collector: the agent keeps answering; what breaks is your ability to see it.
Stop the collector, on purpose, with a task that restores it even if you interrupt the drill. The hold has to outlast the rule’s 2-minute for: window plus a scrape, or the container is back before the alert fires:
CHAOS_HOLD_SECONDS=180 mise run chaos:collectorIt prints this much, then holds silent for three minutes before restarting the container:
[chaos:collector] $ ./scripts/chaos-drill.sh collector
 Container agentops-observability-otel-collector-1 Stopping
 Container agentops-observability-otel-collector-1 Stopped
otel-collector stopped for 180s; watch ObservabilityCollectorDown move pending -> firing
Predict before you poll. Prometheus scrapes that container every 15 seconds and the rule waits a 2-minute for: window. Does the alert fire in 15 seconds, in 2 minutes, or somewhere in between? Leave that terminal holding and open a second one:
for i in $(seq 1 20); do
  state=$(curl -s 'http://localhost:9090/api/v1/rules?type=alert' \
    | jq -r '.data.groups[].rules[] | select(.name=="ObservabilityCollectorDown") | .state')
  echo "$(date +%H:%M:%S) $state"
  [ "$state" = firing ] && break
  sleep 15
done
22:29:00 pending
22:29:15 pending
22:29:30 pending
22:29:45 pending
22:30:00 pending
22:30:15 pending
22:30:30 pending
22:30:45 pending
22:31:01 firingTwo minutes of pending — one scrape to notice the target is down, then the whole for: window — and then firing. Alertmanager has it a moment later:
curl -s 'http://localhost:9093/api/v2/alerts' \
  | jq -r '.[] | "\(.labels.alertname) \(.labels.severity) \(.status.state)"'
ObservabilityCollectorDown page activeThe same alert in Alertmanager’s own view, which is what an on-call engineer opens:
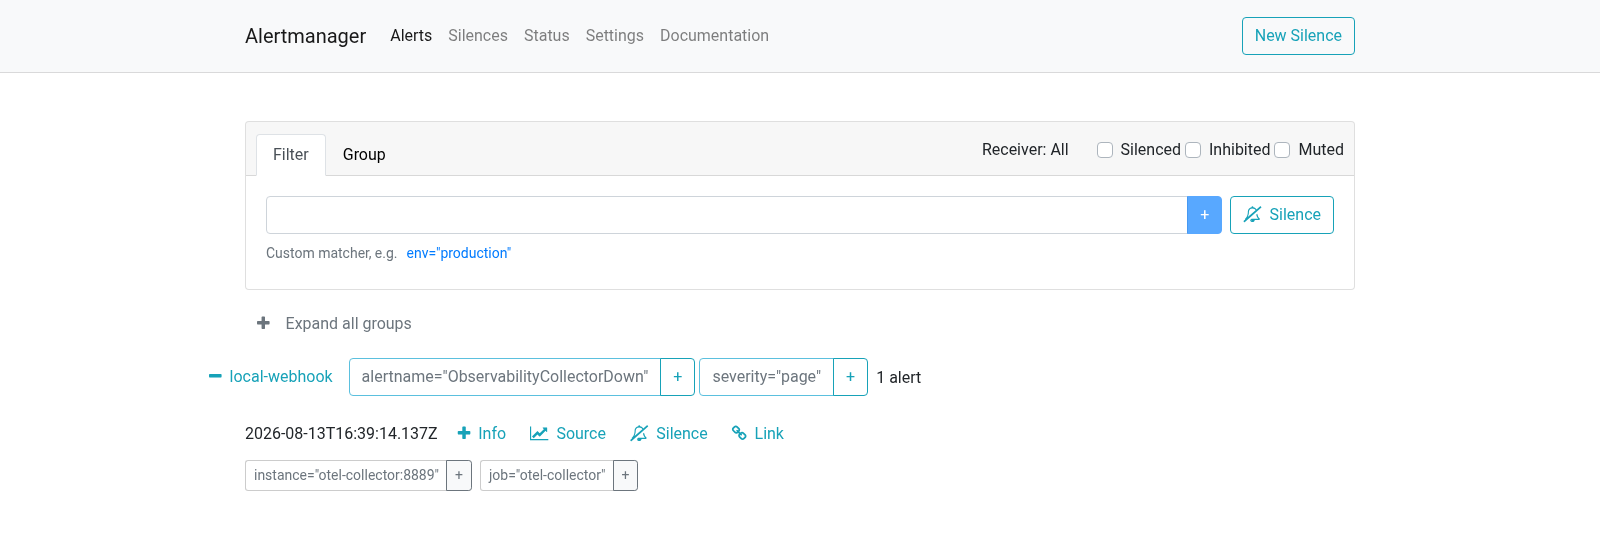
Read the grouping rather than the alert. Alertmanager filed it under the receiver it will notify and the two labels it grouped on, so a second alert sharing alertname and severity joins this group instead of sending a second notification — that grouping stands between one bad night and twenty separate pages. The two labels underneath identify what broke; the timestamp is when it started, not when you looked.
The agent kept answering the entire time. The gap between “the service is fine” and “you cannot see the service” is the incident.
When the hold expires, the first terminal finishes what it started — as it would have after a Ctrl-C:
 Container agentops-observability-otel-collector-1 Starting
 Container agentops-observability-otel-collector-1 Started
restored otel-collector
A scrape or two later the alert resolves by itself. The traces, metrics, and logs for the outage window are gone permanently, because nothing backfills them — which is why a dark pipeline pages rather than waiting for the morning.
You just drove a real alert through its whole lifecycle — pending, firing, routed, resolved — against the same rule file Kubernetes loads.
Page on symptoms, ticket on everything else
The rule that just fired is one of two that page. The split is deliberate: page only on sustained, user-visible symptoms and on a dark telemetry pipeline; everything else ships as a ticket-severity signal.
An error budget is the share of requests a service level objective allows to fail — here, 1% of spans, which is a 99% span-success SLO. A burn rate is how fast you are spending that budget relative to the objective’s window. The paging rule uses both, plus a floor:
- alert: AgentErrorBudgetBurn
  expr: |-
    agentops:calls:error_ratio_rate5m > (14.4 * 0.010)
      and agentops:calls:error_ratio_rate1h > (14.4 * 0.010)
      and sum(increase(agentops_calls_total{status_code="STATUS_CODE_ERROR"}[5m])) >= 3
  for: 2m
Burning that budget at 14.4 times the objective’s even rate empties a 30-day allowance in 30/14.4 days — about two — fast enough to justify waking someone. Requiring the fast 5-minute and the slow 1-hour window to agree, a multiwindow burn condition, stops a brief spike from paging, and the separate three-failure floor handles sparse lab traffic where one bad request is 100% of the sample.
agentops:calls:error_ratio_rate5m is a recording rule — a query Prometheus precomputes and stores as its own series, so the alert reads one cheap value instead of recomputing a ratio on every evaluation.
That SLO really is stated in spans, and the recording rule takes it literally: it carries no span_name filter, so its denominator holds every span the connector sees — model calls, millisecond-long execute_tool spans, and the synthetic observability-check span each mise run observability:up pushes — and a turn with three tool hops weighs four times one with none. Hold both sides to a single unit:
sum(rate(agentops_calls_total{span_name=~"invoke_agent .*",status_code="STATUS_CODE_ERROR"}[5m]))
  / sum(rate(agentops_calls_total{span_name=~"invoke_agent .*"}[5m]))
ADK opens invoke_agent <name> once per turn, so that reads failed turns over turns. Confirm your turns carry the failure before you switch: in the trace on 7.1. Tracing the root span stays UNSET while the model call under it ends STATUS_CODE_ERROR, so scope to generate_content .* instead when that is where your errors land.
Nine alerts ship, each grounded in a metric this stack verifiably exports. Read Window as the rule’s for: — how long the condition must hold before pending becomes firing — not the rate window inside an expression:
| Alert | Severity | Metric | Fires on | Window | Respond |
|---|---|---|---|---|---|
AgentErrorBudgetBurn | page | agentops_calls_total | multiwindow burn plus ≥3 failures in 5m | 2m | error budget |
ObservabilityCollectorDown | page | up{job="otel-collector"} | up{job="otel-collector"} == 0 — traces, metrics, and logs are all dark | 2m | collector down |
AgentTurnLatencyP95High | ticket | agentops_duration_seconds_bucket | p95 across all agent spans above 15s over [10m]; tune to your hardware | 5m | latency |
AgentTokenTelemetryMissing | ticket | agentops_tokens_token_total | spans flowing but no token counter increase | 10m | collector down |
AgentInjectionNeutralizedSpike | ticket | agentops_guardrails_injections_neutralized_total | more than 3 neutralized injections in 15m | 2m | guardrail / schema |
AgentTriageSchemaFailures | ticket | agentops_triage_report_schema_failures_total | any triage-schema failure in 15m | 2m | guardrail / schema |
AgentModelSpendBudgetBurn | ticket | agentgateway_gen_ai_client_cost_usd_total | hourly spend above four times the stated budget’s even burn | 15m | cost |
AgentModelUnpriced | ticket | agentgateway_cost_catalog_lookups_total | any Missing catalog lookup in 15m | 5m | cost |
AgentModelBudgetRefusals | ticket | agentgateway_requests_total | any RateLimit refusal on the llm listener in 10m | 5m | cost |
The token counter reads agentops_tokens_token_total rather than agentops_tokens_total because the collector’s Prometheus exporter appends the unit suffix.
The host Compose stack loads these rules into Prometheus at http://localhost:9090/alerts and hands what fires to Alertmanager at http://localhost:9093. Read infra/observability/alertmanager.yml before you trust the Severity column: its only sub-route matches category = "cost" and nothing matches severity, so a page and a non-cost ticket reach the same placeholder webhook after the same 30-second wait and repeat on the same four-hour cycle. That file concedes the point itself — “Routing is where an alert’s urgency is actually expressed; the severity label only describes it” — and one more entry under its route.routes: settles it:
- matchers:
    - severity = "page"
  receiver: local-webhook
  group_wait: 0s
  repeat_interval: 30m
Point that receiver at a channel that really rings once you have one; no external paging service exists anywhere in this course.
The local Kubernetes overlay runs not merely equivalent rules but the same bytes: infra/observability/prometheus-rules.yml is a symlink to infra/k8s/overlays/local/prometheus-rules.yaml, the ConfigMap source kustomize reads. One file, two planes, no drift — and one consequence before you edit it: a change you make “for Compose” is also a change to what the cluster loads. That overlay’s Alertmanager has no integration at all: default-deny egress keeps notifications cluster-internal, and network policies let only Prometheus reach it.
Two failure classes never page, because they are judgements rather than thresholds: a quality incident, where answers are wrong rather than absent, and a cost incident, where a prompt change quietly doubled tokens. Treat both as first-class incidents anyway — 7.7. Incident Response shows how they surface.
Deeper: why your first deliberate guardrail event may not fire its alert
increase() needs at least two samples of a series inside its window, so the very first guardrail or schema event after startup may register as nothing at all. Send a few before concluding the rule is broken. The same subtlety is why AgentTokenTelemetryMissing gates on real span traffic instead of using a bare absent(), which would fire on every idle lab.
The four responses worth memorising
An alert without a response is a notification. Six of the nine map onto one of four walks, each starting from a panel or trace view you can already read.
AgentErrorBudgetBurn — turns are failing. The dashboard’s error-ratio panel rises with the alert. Check the provider first: curl -fsS http://127.0.0.1:4000/v1/models through the gateway, and ollama ps on the host; in Kubernetes, kubectl -n agentops get pods and the agentgateway logs. The usual cause is a stopped Ollama, a missing qwen3:4b-instruct pull, a wrong OLLAMA_HOST binding, or a gateway route rejecting the upstream. Fix it, then watch the ratio decay and the alert resolve in Alertmanager rather than assuming it did.
AgentTurnLatencyP95High — turns complete, slowly. Open the slowest recent trace in Grafana’s Tempo view and read which span dominates, exactly as in 7.1. Tracing; check ollama ps for model load state and the host for CPU pressure. Model cold starts, contention with other workloads, and oversized contexts from long sessions are the three common answers. If your hardware is simply slower, raise the threshold in the rules file deliberately rather than deleting the alert.
ObservabilityCollectorDown or AgentTokenTelemetryMissing — the dashboards flatten while the agent still answers. The pipeline is broken, not the agent. Check the container with docker compose -f infra/observability/compose.yaml ps otel-collector, then ask whether the counter is being exported at all. Compose keeps :8889 on the internal network, so ask the scraper that already reaches it:
docker compose -f infra/observability/compose.yaml exec -T prometheus \
  wget -qO- http://otel-collector:8889/metrics | grep agentops_tokens
Empty output is the answer, not a broken command: the counter is genuinely absent, which is exactly the condition AgentTokenTelemetryMissing fires on. In Kubernetes, kubectl -n agentops port-forward svc/otel-collector 8889:8889 first and curl the forwarded port. The usual causes are a collector crash or memory-limit kill, a port conflict from running host Compose and a forwarded in-cluster stack together, or an agent started without OTEL_EXPORTER_OTLP_ENDPOINT so spans arrive from one process and metrics from none.
AgentInjectionNeutralizedSpike or AgentTriageSchemaFailures — user traffic looks normal. Filter Loki for recent turns with {service_name="agentops-agent"}, follow a matching line’s TraceID link into Tempo, and inspect which tool output carried injection markers or which report failed validation. Injections usually mean adversarial content in the data the tools read — or someone running the offline red-team suite. Schema failures usually mean model or prompt drift after a swap: re-run the offline tests and evaluation gates and restore the pinned model and prompt combination before trusting new reports.
The three cost alerts, answered on the Cost Governance page
The remaining three fire on money rather than on health, and all three file a ticket. AgentModelSpendBudgetBurn reads the gateway’s cost counter as a burn rate against a stated budget, exactly as AgentErrorBudgetBurn reads errors against an error budget. AgentModelUnpriced catches the failure that makes a cost dashboard lie: tokens served for a model the catalog never priced are counted at zero, so every figure downstream undercounts. AgentModelBudgetRefusals fires on 429s from the model route’s own buckets — either a caller is overspending or the cap is smaller than one honest turn.
Their walk lives on 7.3b. Cost Governance, which owns the model catalog, the per-caller budget, and the panels that tell those two cases apart. This page decides who gets woken; that one decides who pays.
Your turn: add an alert rule and point it at a response
The chapter checkpoint asks for this one. A rule that has never fired is a hypothesis; a rule with a deterministic test is a check. All nine shipped rules now carry one — read infra/observability/tests/agent-error-budget-burn.yml before you write yours, because a burn-rate rule is a conjunction of three vetoes and a test that only shows it firing proves the least interesting third of it.
Derive the objective before you write the rule, because a threshold you were handed is a threshold you cannot defend. Take the p95 from your own k6 baseline in 7.2. Monitoring — the number your machine produced, not the one on this page — and write one sentence shaped “N% of turns complete within T over a W window”, filling T from that measurement plus the headroom you will spend and W from how long you would tolerate being wrong. The shipped 99% arrived that way and is no constant of nature: a laptop that answers in ninety seconds cannot honour a two-second objective, and a rule holding it to one pages you nightly until you stop reading the page.
Predict first: promtool test rules replays a synthetic series through your expression without any Prometheus running. If your rule has a for: 5m window, what should the alert’s state be at evaluation minute 3?
- Mode:
keep. - Goal: add one Prometheus alert tied to an observable outcome, drive it inactive-then-pending-then-firing against a fixed input series, and point its
runbook:annotation at the written response an on-call engineer should open when it fires. - Files to touch:
infra/k8s/overlays/local/prometheus-rules.yaml— reach it through either path, they are the same file — plus a newinfra/observability/tests/<alert-name>.ymlrule test. - Preflight: choose a name, require the new test path to be absent with
test ! -e, and requiregit diff --quiet -- infra/k8s/overlays/local/prometheus-rules.yaml. Check the real path, not the symlink:git diffoninfra/observability/prometheus-rules.ymlcompares the link target string and stays quiet whatever you write into the rules. - Steps: write the objective sentence down first, then model the rule and its test on the shipped
ObservabilityCollectorDownpair — the test ininfra/observability/testsis a complete worked example, annotation strings included. Sustained tool-error rate and a p95 latency breach are both defensible choices. Give your rule the same three annotations the shipped nine carry —summary,description, and arunbook:URL in the identical form,https://github.com/MLOps-Courses/agentops-open-course/blob/main/content/7.%20Observability/...— aimed at the section that answers your alert, because the link an on-call engineer opens must land on a response, not a 404. Pick the four responses for a health symptom, 7.3b. Cost Governance for a spend one; if neither describes your walk, write the paragraph that does into the matching page first and point at its anchor. - Gate that proves completion: you can state your objective in one sentence and name the k6 figure it came from; both commands below pass; your rule test asserts the alert inactive, pending for its declared window, firing with the exact runbook annotation, and then resolved; and the anchor that annotation names really exists —
rg --fixed-strings 'responses worth memorising' 'content/7. Observability/7.2b. Alerting.md'prints the heading your URL points into. - Final state: keep the rule and the deterministic test;
git status --shortshows no generated Prometheus data. Driving the condition against the live stack is optional runtime evidence and must be stopped afterwards.
promtool check rules infra/observability/prometheus-rules.yml
promtool test rules infra/observability/tests/<alert-name>.yml
Checking infra/observability/prometheus-rules.yml
SUCCESS: 13 rules found
SUCCESSThat is both commands run back to back against the shipped rules only — four recording rules and nine alerts. Your addition makes it fourteen.
Every shipped rule points at a section of this chapter, so the response is written once, reviewed like the rest of the course, and reachable from a phone. It is emphatically not written into agents/data/runbooks/: that directory is the fictional service’s immutable retrieval corpus, and putting the platform’s own on-call instructions there silently crosses a trust and domain boundary — the agent would quote its own operating manual as customer evidence.
What you can do now
- You can say why
ObservabilityCollectorDowntakes two minutes to fire, and read the grouping Alertmanager files it under. - You can explain why only two of the nine alerts page, and what the
14.4multiplier and the three-failure floor each prevent. - For any of the nine, you can name the first signal to open and the most likely cause.
- You can check a rule with
promtool check rulesand assert its pending-to-firing transition withpromtool test rules.
Whether a phone rings is now a rule you can read, a budget you can defend, and a response someone can open.
Continue to 7.3. Costs, which measures the tokens one session spends and prices them — the budget AgentModelSpendBudgetBurn compares against does not exist until you set that number.